Gold Price Action : Gold’s inverse relationship with the US Dollar could see the precious metal continue to track lower in the near-term, given that the upcoming US presidential election on November 3 will more than likely stoke volatility up until the point that a winner is announced.
- Spot Gold Below $1703 Downside Target $1690—$1682 – Don’t Panic @ Lower Level
- Gold Spot : Buy Above $1958, Target $1900 — $1920 (Buy 1000—500 Lots)
- PRECIOUS METALS VOLATILITY KEEPS HEADING LOWER, BUT GOLD PRICES ARE NOT….
- Is Gold Really a Good Hedge?
- MCX Gold Looks Like Descending Hawk Pattern, We See Big Move Here 500—800 Point
Although Democratic nominee Joe Biden is holding a significant lead over President Donald Trump in the national polls his margin has notably narrowed, with the rate of change favouring the Republican incumbent.
In fact, the deterioration in Mr Biden’s lead appears to coincide with the 14-day correction seen in US equity markets, after the former Vice President’s margin ballooned to 10.3 on October 11, according to Real Clear Politics’ polling data.
The benchmark S&P 500 index topped the following day and has since shed as much as 8.9% on the back of Mr Trump’s resurgence.
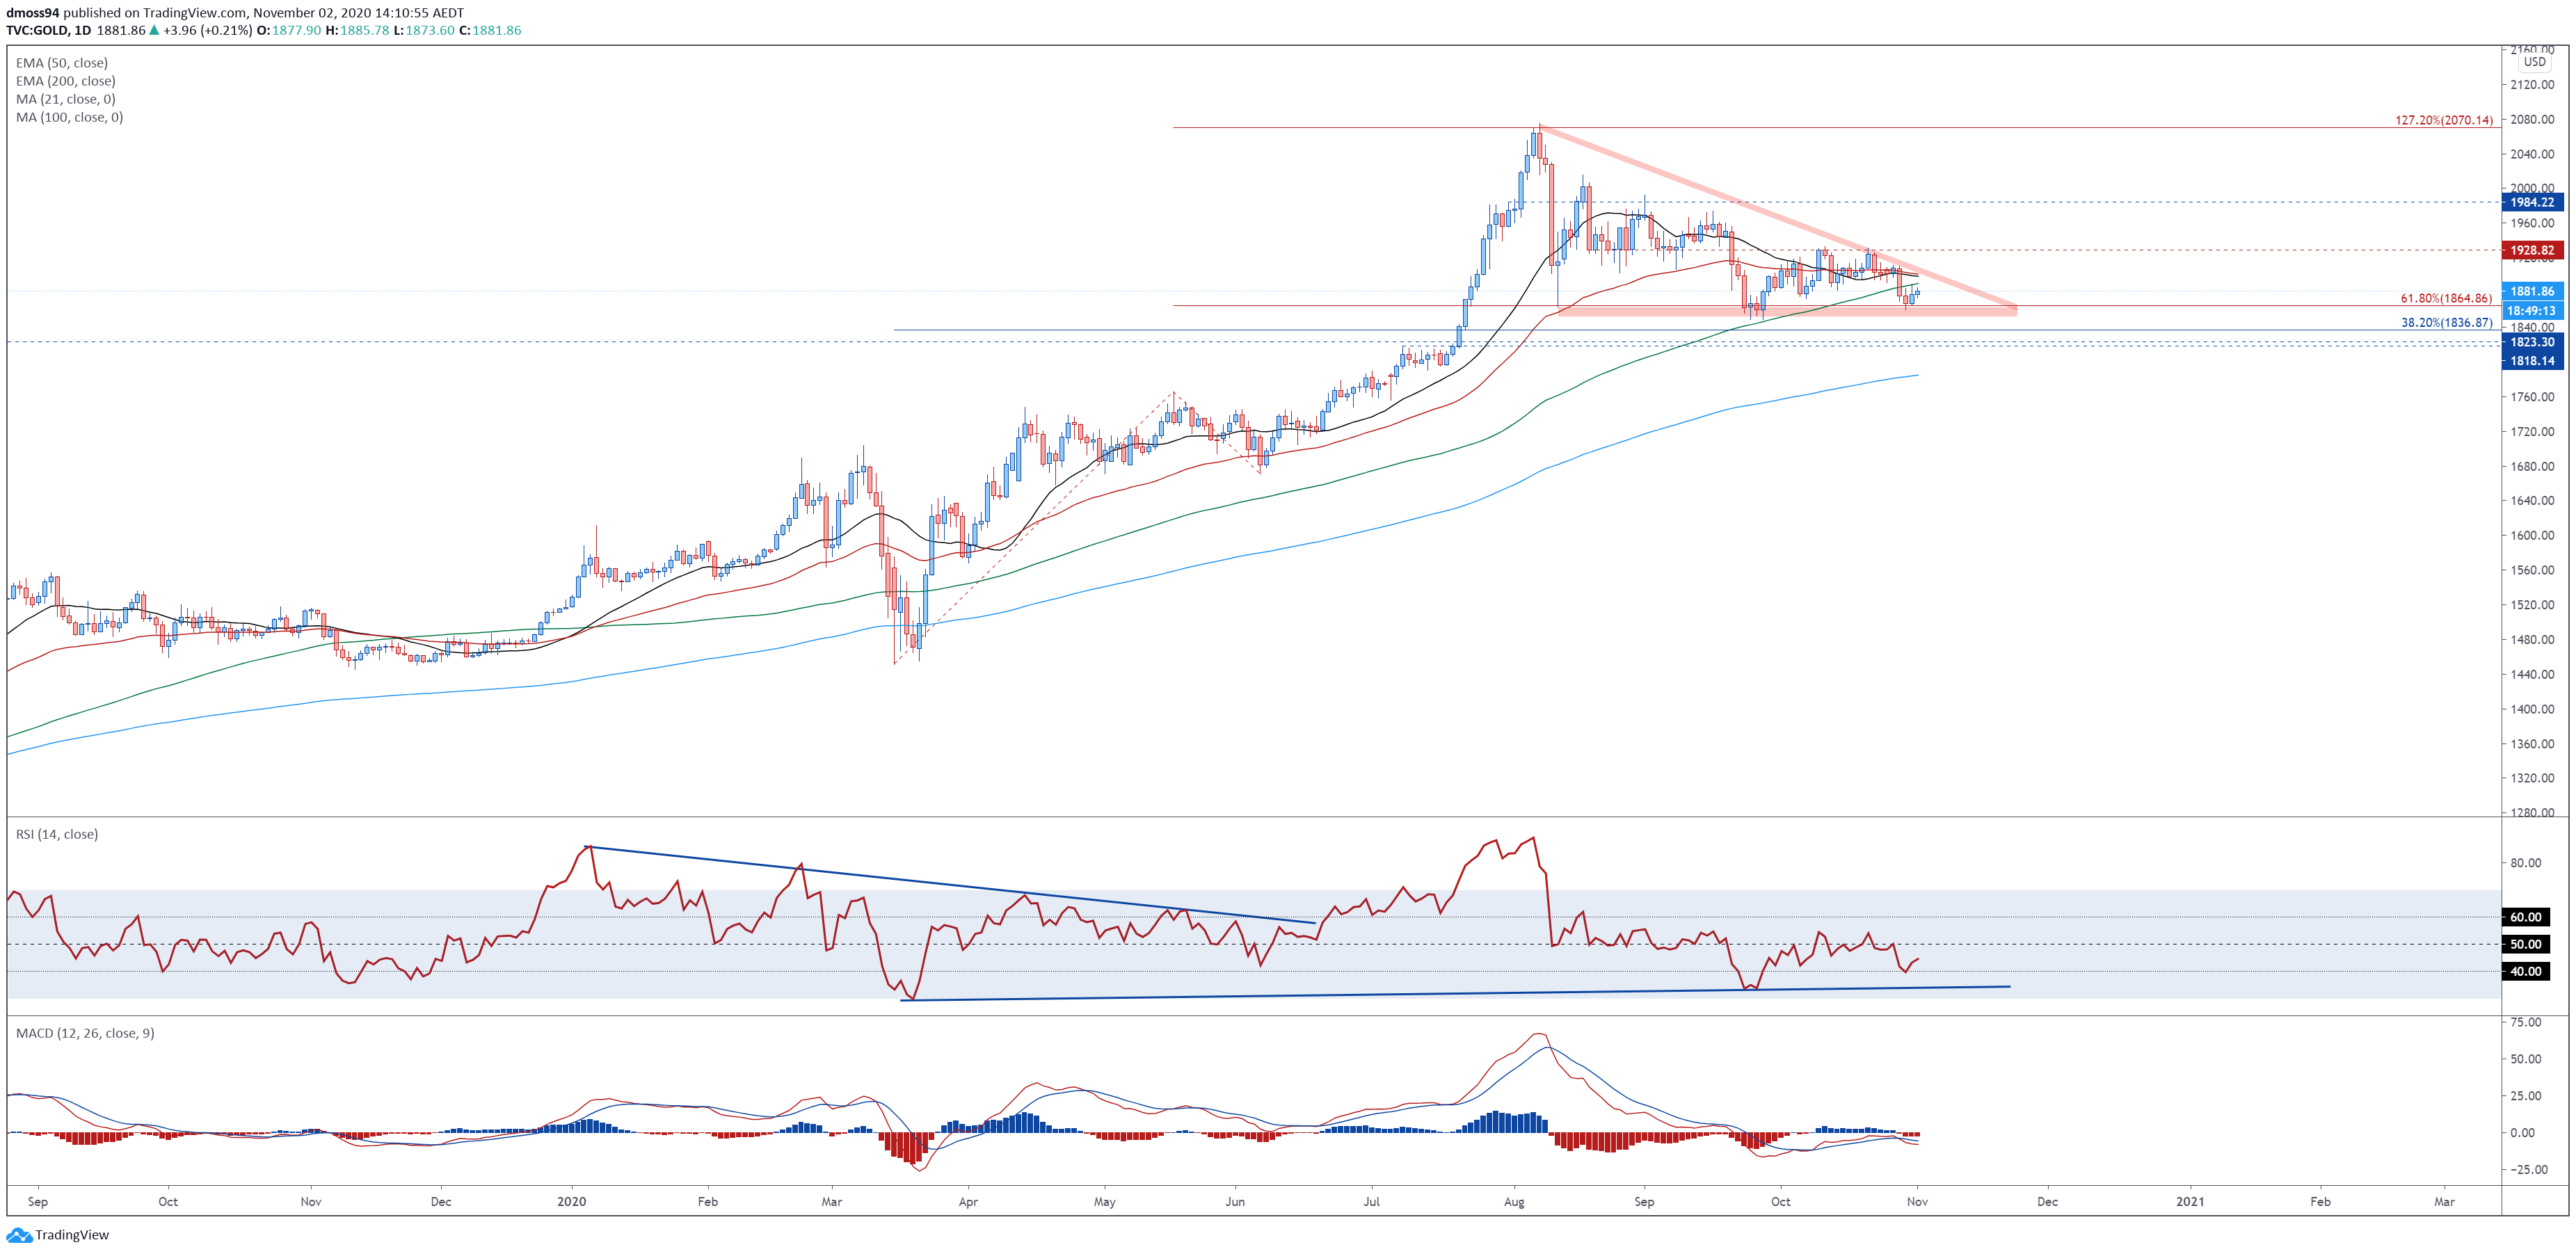
GOLD PRICE DAILY CHART – DESCENDING TRIANGLE IN PLAY?
From a technical perspective, the outlook for gold prices appears skewed to the downside, as price carves out a Descending Triangle pattern just above key psychological support at 1850.
The development of the RSI and MACD indicators hint at swelling bearish momentum, with both oscillators tracking firmly below their neutral midpoints.
That being said, a rebound back towards the Descending Triangle hypotenuse and trend-defining 50-day moving average (1901.68) could be on the cards, if buyers can overcome resistance at the 100-DMA (1890.71).
A daily close above the October high (1933.28) is needed to invalidate the bearish chart pattern and carve a path to test the September high (1992.63).
Conversely, a break and close below the September low (1880.91)) would probably ignite an impulsive downside push back towards the psychologically imposing 1800 mark and bring the sentiment-defining 200-DMA (1785.09) into play.
Disclaimer
This article is intended for educational purposes only. The views and opinions expressed are those of individual analysts or brokerage firms and do not represent the views of GoldSilverReports.com. Investors are strongly advised to consult certified financial experts before making any investment or trading decisions.
| Follow us on |
| Telegram, Whatsapp , Facebook, Twitter, Instagram, YouTube, Google Business Profile and Truth Social. |