
Gold Price Analysis : Gold consolidates on recent recovery rally from $1,764 to $1,895. The four-month falling trendline hurdle is still intact.
Gold Technical Price Outlook
GOLD TECHNICAL ANALYSIS : Gold Support Zone $1840—$1838, Below Target $1810 ——$1780 – Neal Bhai Reports

GOLD TECHNICAL ANALYSIS : Gold prices are under down trend now-familiar range support in the 1840-$1838 Level. Breaking below this barrier on a daily closing basis looks likely to open the door for target $1810/oz figure to challenge former resistance in the $1780 zone. Alternatively, an upswing past the $1910 inflection region probably targets the swing top @ $1958.
Who is winning the US presidential election?

Republican Donald Trump faced Democratic challenger Joe Biden on Tuesday in the US presidential election. There are 538 Electoral College votes allotted to the 50 states and the District of Columbia. It takes 270 votes to win.
82% of the Retail Gold Traders are Net Long Gold – Neal Bhai Reports

Gold Traders : Gold prices rebounded from a key support level of US$ 1,870 amid favorable market sentiment as traders counted down to the US election.
US PRESIDENTIAL ELECTION TO DICTATE GOLD PRICE ACTION
Gold Price Action : Gold’s inverse relationship with the US Dollar could see the precious metal continue to track lower in the near-term, given that the upcoming US presidential election on November 3 will more than likely stoke volatility up until the point that a winner is announced.
Gold Spot : Buy Above $1858, Target $1900 — $1920 (Buy 1000—500 Lots)
Gold Spot : Buy Above $1858, Target $1900 — $1920 (Buy 1000—500 Lots)
GOLD PRICE DAILY CHART – DESCENDING TRIANGLE IN PLAY?
Gold prices had coiled into a falling wedge pattern but a failed break has muddied the outlook (2020)
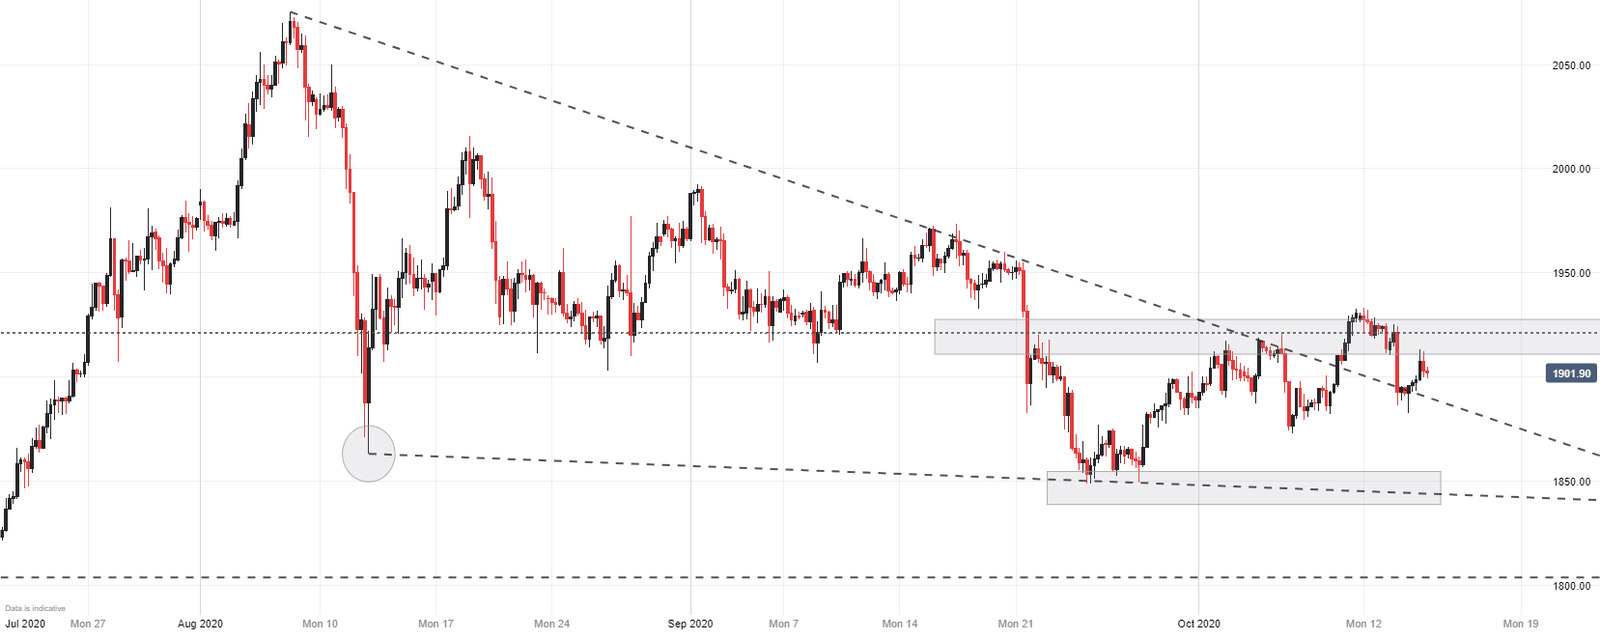
Gold prices looked primed for a topside break out last week as it coiled into a falling wedge formation. The pattern was marked by a descending trendline to the topside, derived from the August high, and a trendline on the lower end around the $1,850 mark.