Spot gold was down 0.2% at $1,867.36 per ounce by 0333 GMT, after hitting its highest since September 2011 at $1,876.16 in early Asian trade.
gold price chart
Gold Settles at a Nearly 9-year high and Silver Scores Highest Finish since 2014 on Fiscal Stimulus Moves

Gold futures climbed Tuesday to settle at a nearly nine-year high and silver rallied to prices not seen since 2014, with the precious metals lifted by an agreement on a fiscal rescue plan by European leaders and expectations for additional spending by the U.S. government.
Silver MCX Sell CMP 53924 Trade With Stop Loss (Closing Basis) 54555 Target Open – Neal Bhai Reports
Silver MCX Sell CMP 53924 Trade With Stop Loss (Closing Basis) 54555 Target Open – Neal Bhai Reports
Doomsday Hedge Fund Sees Gold Topping $3,000 an Ounce

Gold could rise to $3,000 to $5,000 an ounce in the next three to five years, up from the current price of $1,800.
Why Gold Prices are Rising Despite Weak Demand at Jewellery Shops
![MCX Gold Target 98,500 Very Very Soon, Buy on Dips [21 April 2025]](https://www.goldsilverreports.com/wp-content/uploads/2020/03/gold-052904-gsr.jpg)
Why Gold Prices are Rising: – Western investors piling into gold in the pandemic are more than making up for a collapse in demand for physical metal from traditional retail buyers in China and India, helping push prices to an eight-year high.
Gold Market Analysis : Next Week Unexpected Down Fall Expected

Gold markets went back and forth during the course of the week, forming a bit of a neutral candlestick. However, we did break above the $1800 level at one point which of course is a bullish sign.
Spot Gold Sell Between $1772—$1775 Target and SL Paid – Neal Bhai Reports
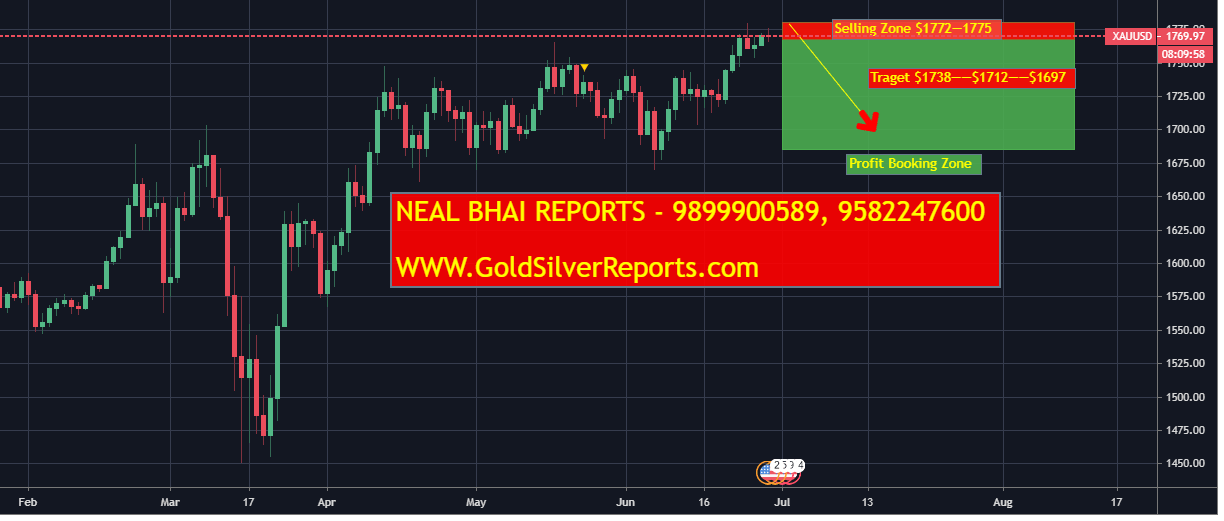
Spot Gold Sell Between $1772—$1775 Target and SL Paid – Neal Bhai Reports