
Gold price steadied after advancing for two days as investors weighed the prospects of further U.S. stimulus and the latest reading on inflation.
Spot Gold
At Gold Silver Reports, we provide real-time updates on Spot Gold (XAUUSD) with live prices, expert analysis, and daily trading insights. Stay ahead with accurate forecasts, support & resistance levels, and global gold market trends to guide your trading strategies.
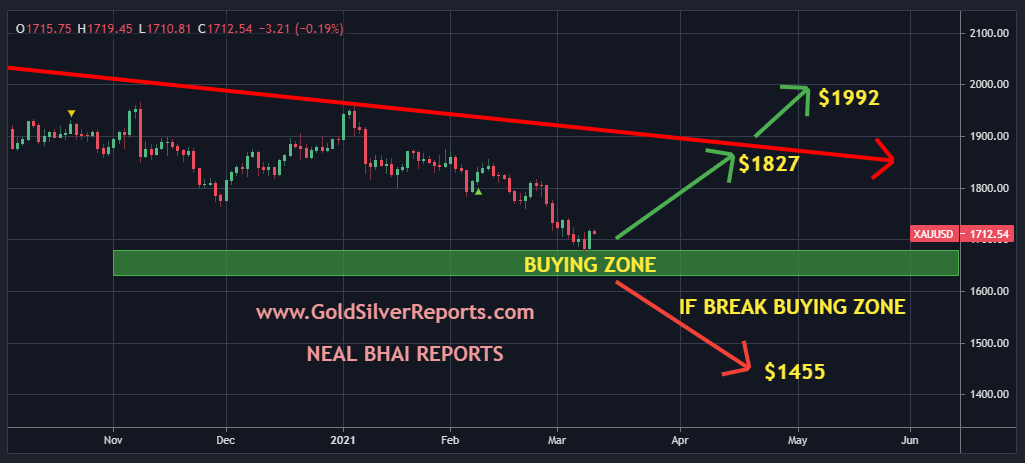
Spot Gold Price Forecast Target Price $1827 | Neal Bhai Reports
spot gold price forecast 2021 : Gold bulls take a breather after the 2% recovery rally witnessed on Tuesday. The haven demand for the US dollar has returned amid a cautious market mood, as investors await the House of Representatives vote on the Senate’s $1.9 trillion stimulus bill this Wednesday.
Gold Prices Today Hit three-day High, Around $1720 level
![MCX Gold Target 98,500 Very Very Soon, Buy on Dips [21 April 2025]](https://www.goldsilverreports.com/wp-content/uploads/2020/03/gold-052904-gsr.jpg)
Gold prices today built on its goodish intraday positive move and climbed to three-day tops, around the $1720 region during the early North American session.
Gold Price Forecast : Gold Trading Key Zone $1650-$1720

Gold Price Forecast : Yellow Metal has sold off to the fifty-five month moving average at $1720, between here and the $1650 uptrend, the Bullion should stabilize.
Spot Gold Price Forecast & Analysis 01 March 2021

Spot Gold Price Forecast & Analysis 01 March 2021 : Gold price’s last decline stopped at $1716.00 level, to rebound bullishly and begins recovering now, as it surpassed the intraday bearish channel’s resistance that appears on the chart and opens the way to continue the rise in the upcoming sessions, on its way to test $1760.00 mainly.
Gold Prices Needs to Break $1827 for Next upside Level

Gold Prices Needs to Break $1827 for Next upside Level, US President Joe Biden’s stimulus package heads towards House vote, Gold’s comeback from multi-month lows gathers momentum into the 3rd straight session this Tuesday 23, 2021. Gold is building on Monday’s 1.5% surge, as rising worldwide inflation expectations bode well for the inflation-hedge.
GOLD Spot Weekly Outlook (February 22 – 26, 2021)

GOLD Spot Weekly Outlook (February 22 – 26, 2021). Improve your technical analysis of live gold prices with the real-time gold (XAU/USD) chart, and read our latest expert analysis and gold price forecast.