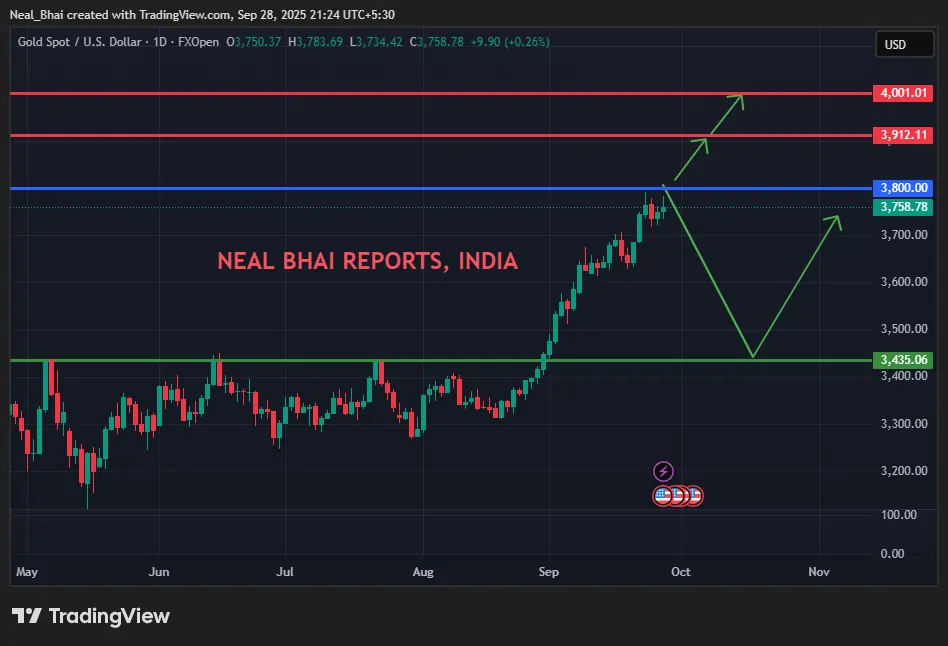
Gold Spot Price Technical Analysis [29-09-2025] – Based on the chart, the gold (XAU/USD) daily chart shows an ascending triangle pattern, which is generally considered a bullish signal. The price is currently near a breakout level around 3435.06, with a potential target near 3900.00 if the upward trend continues. The RSI (14) at 74.53 suggests the asset is in overbought territory, which could indicate a potential pullback or consolidation.
Read More About Gold Spot Price Technical Analysis
- XAUUSD Technical Analysis – Neal Bhai (29 August 2025)
- XAU/USD Ready For Big Dhamaaka – Neal Bhai (2025)
- XAU/USD (Gold) Magic Level for Trading: Can It Move $400 Up or Down till September 2025?
- XAU/USD Price remains range-bound between $3,300 and $3,340 as traders stay cautious
From a technical perspective, the XAU/USD pair has been facing some resistance near a downward-sloping trend line extending from the all-time peak touched earlier this week. The downside, however, remains cushioned near the $3,720-3,715 horizontal zone, which should now act as a key pivotal point for intraday traders. Sustained weakness below, leading to a subsequent break through the $3,700 mark, might prompt some technical selling and pave the way for an extension of this week’s retracement slide from the record high. The subsequent downfall could drag the Gold price to the $3,650 intermediate support en route to the $3,610-$3,600 region.
Gold price
Meanwhile, the aforementioned trend-line is currently pegged near the $3,753-3,754 area and should act as an immediate strong barrier for the Gold price. A sustained move beyond, however, might set the stage for a move towards challenging the all-time peak, around the $3,790 area touched on Tuesday. Some follow-through buying and acceptance above the $3,800 mark would be seen as a fresh trigger for the XAU/USD bulls, which, in turn, should pave the way for the resumption of a well-established uptrend witnessed over the past month or so.