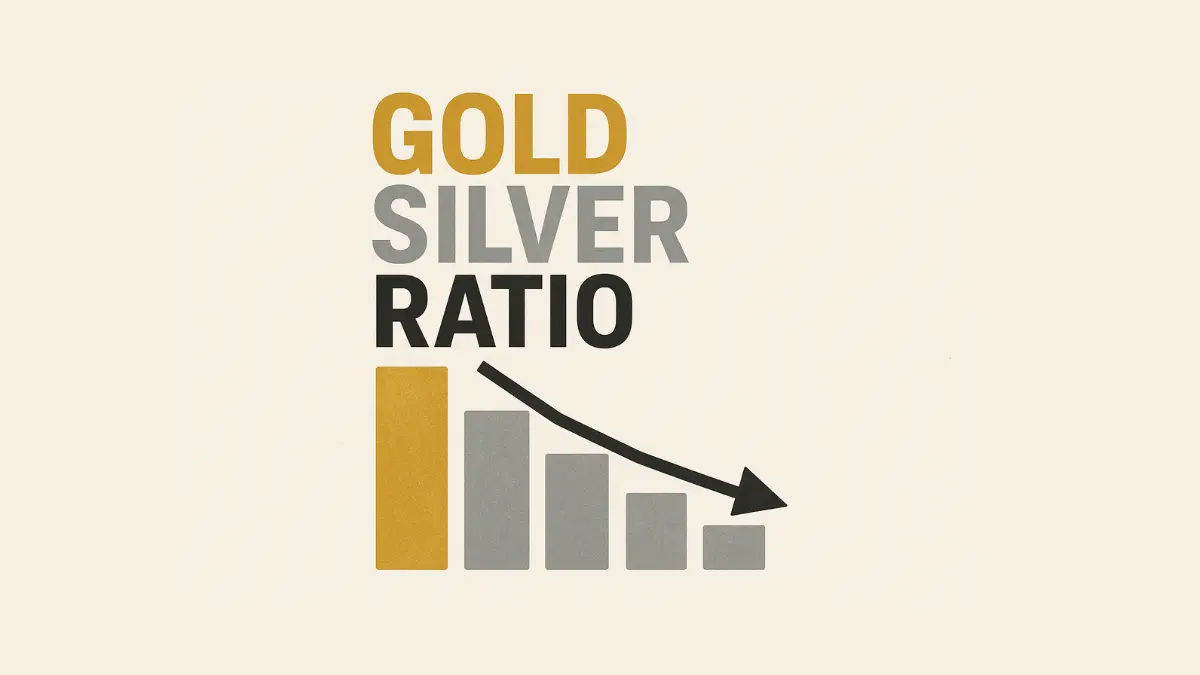
The Gold Silver Ratio stands at 81.5:1 as of September 2025, meaning you need 81.5 ounces of silver to buy one ounce of gold. This ratio currently sits 30% above its historical average of 60-65:1, suggesting silver may be undervalued compared to gold. For Indian investors, this presents a strategic opportunity as silver has delivered exceptional returns of 56% in 2025, outperforming gold’s impressive 49% gains. Understanding this ratio is crucial for optimizing your precious metals investment strategy and timing your entry and exit points effectively.
Understanding the Gold Silver Ratio: The Basics Made Simple
- 1 What Exactly is the Gold Silver Ratio?
- 2 How to Calculate the Gold Silver Ratio
- 3 🟡 Gold-Silver Ratio Calculator
- 4 Gold-Silver Ratio Calculator
- 5 Why This Ratio Matters for Indian Investors
- 6 Ancient and Medieval Periods
- 7 The American Standard Era
- 8 20th Century Volatility
- 9 21st Century: The Era of Extremes
- 10 Present Ratio Analysis
- 11 Indian Market Performance in 2025
- 12 Factors Driving Current Trends
- 13 The Classic 80/50 Rule
- 14 Mean Reversion Strategy
- 15 Extreme Level Trading
- 16 Three-Way Relationship Strategy
- 17 Portfolio Allocation Recommendations
- 18 Investment Vehicles Available in India
- 19 Tax Implications and Considerations
- 20 Economic Indicators
- 21 Industrial Demand Dynamics
- 22 Supply-Side Factors
- 23 Expert Predictions for 2025-2026
- 24 Long-term Trends to Watch
- 25 Potential Risk Factors
- 26 Conservative Investors
- 27 Moderate Risk Investors
- 28 Aggressive Traders
- 29 NRI Considerations
- 30 Common Mistakes to Avoid
- 31 Timing Errors
- 32 Strategic Missteps
- 33 Practical Oversights
- 34 Conclusion: Making the Gold Silver Ratio Work for You
What Exactly is the Gold Silver Ratio?
The Gold Silver Ratio is a simple yet powerful metric that shows how many ounces of silver you need to buy one ounce of gold. Think of it as a comparison tool between these two precious metals. For example, if gold costs ₹97,500 per 10 grams and silver costs ₹1,10,000 per kilogram, the ratio works out to approximately 88:1.
This ratio acts as a market indicator that helps investors understand which metal might be relatively cheaper or expensive at any given time. When the ratio is high, silver appears cheaper compared to gold. When it’s low, gold seems more attractive relative to silver.
How to Calculate the Gold Silver Ratio
The Gold-Silver Ratio (GSR) is a simple but powerful tool for comparing the value of gold to silver. It tells you how many ounces of silver are needed to buy one ounce of gold.
🟡 Gold-Silver Ratio Calculator
Gold-Silver Ratio Calculator
📊 How to Use:
- High Ratio (e.g., 80–100): Gold is expensive relative to silver → Silver may be undervalued.
- Low Ratio (e.g., 40–50): Silver is expensive relative to gold → Gold may be undervalued.
- Traders use it to switch between gold and silver positions depending on which looks cheap.
⚡Tip: You can check live prices on sites like Kitco, Investing.com, or TradingView, then just divide gold’s price by silver’s price to get the ratio.
Why This Ratio Matters for Indian Investors
The Gold Silver Ratio serves multiple purposes for investors in India:
Market Timing: It helps identify when to buy or sell these metals. A historically high ratio suggests silver might be a better buy, while a low ratio might favor gold.
Portfolio Balancing: Indian investment experts recommend allocating 8% of your portfolio to gold and 15% to silver. The ratio helps fine-tune these allocations based on relative valuations.
Loan Leverage: With RBI allowing gold loans up to 75% LTV (Loan-to-Value), understanding the ratio helps optimize your borrowing strategy using gold as collateral.
Historical Journey: From Ancient Times to Modern Markets
Ancient and Medieval Periods
The Gold Silver Ratio has a fascinating history spanning over two millennia. During the Roman Empire, the ratio was officially fixed at 12:1. This meant 12 ounces of silver equaled one ounce of gold. This relatively tight ratio reflected the natural abundance of these metals in the Mediterranean region.
In medieval Europe, the ratio fluctuated between 9.4:1 in 1350 and 12:1 in the 1450s. The discovery of massive silver deposits in the Americas during the 15th and 16th centuries caused significant disruptions to this historical stability.
The American Standard Era
The United States government fixed the ratio at 15:1 with the Coinage Act of 1792. This official rate remained relatively stable for decades, providing monetary stability to the young nation. However, market forces eventually challenged these fixed ratios.
20th Century Volatility
The 20th century marked the beginning of extreme volatility in the Gold Silver Ratio. The average ratio for the entire 20th century was 47:1, but it experienced wild swings:
- 1930s-1940s: The ratio hit 90:1 during the Great Depression
- 1980: During the precious metals boom, it compressed to just 17:1
- 1991: It peaked at an extreme 98:1 when silver prices collapsed
21st Century: The Era of Extremes
The modern era has seen the ratio fluctuate between 35:1 and 124:1. Key milestones include:
2008 Financial Crisis: The ratio spiked to 83:1 as investors fled to gold’s safet
2011 Recovery: Post-crisis optimism pushed the ratio down to 31:1
2020 COVID Pandemic: Reached a modern record of 124:1 as gold soared while industrial demand for silver collapsed
Current Market Scenario: Where We Stand in 2025
Present Ratio Analysis
As of September 2025, the Gold Silver Ratio stands at 81.5:1. This level is significantly elevated compared to historical norms:
- 30% above the long-term average of 60-65:1
- 13% above the 10-year average of 81:1
- Well within the “silver-favoring” zone according to traditional trading rules
Indian Market Performance in 2025
The Indian precious metals market has witnessed extraordinary performance in 2025:
Gold Performance: Started the year around ₹60,000 per 10 grams and reached ₹97,500, delivering 49% returns
Silver’s Stellar Show: Beginning at approximately ₹75,000 per kilogram, silver soared to ₹1,10,000, posting an impressive 56% gain. This represents silver’s best annual performance in 10 years.
Historical Context: The last time silver delivered such spectacular returns was in 2020, when it rose 44% during the pandemic-driven precious metals rally.
Factors Driving Current Trends
Several key factors are shaping the current Gold Silver Ratio:
Central Bank Buying: Major central banks, particularly China and India, have been accumulating significant gold reserves. China alone purchased 15 tonnes of gold in late 2024.
Industrial Demand for Silver: Unlike gold, 52% of silver demand comes from industrial applications. The clean energy revolution, particularly solar panels and electric vehicles, is driving unprecedented industrial demand.
Geopolitical Tensions: Ongoing global uncertainties continue to support gold prices as a safe-haven asset.
Smart Trading Strategies Using the Gold Silver Ratio
The Classic 80/50 Rule
The most popular strategy among precious metals investors is the “80/50 Rule”:
- When the ratio exceeds 80: Consider buying silver (as it appears relatively cheap)
- When the ratio falls below 50: Consider buying gold (as it becomes relatively attractive)
- Between 50-80: Hold your existing positions steady
This strategy has shown a success rate of 70-75% when implemented with proper risk management.
Mean Reversion Strategy
This approach focuses on the ratio’s tendency to return to its historical average:
- Buy silver when the ratio is above 65 (long-term average)
- Buy gold when the ratio is below 65
- Rebalance positions as the ratio approaches the mean
Historical data shows this strategy achieved a 72% success rate between 2011-2020.
Extreme Level Trading
For more aggressive traders, extreme ratio levels offer high-probability opportunities:
- Ratio above 90-100: Heavily favor silver positions
- Ratio below 40: Concentrate on gold investments
- Success rate at extremes: Up to 85%
Three-Way Relationship Strategy
Advanced investors employ strategies involving gold, silver, and copper to capitalize on their different properties:
- Gold: Pure monetary metal (safe haven)
- Silver: Hybrid industrial/precious metal
- Copper: Pure industrial metal
This approach exploits silver’s “impurity” as both an industrial and precious metal.
Indian Investment Context: Practical Applications
Portfolio Allocation Recommendations
Financial experts suggest optimal allocations for Indian investors:
- Gold allocation: 8% of total portfolio
- Silver allocation: 15% of total portfolio
- Total precious metals exposure: 5-10% for optimal diversification
Investment Vehicles Available in India
Physical Gold and Silver: Traditional approach offering tangible ownership but requiring secure storage and insurance
Gold and Silver ETFs: Trade like stocks with expense ratios ranging from 0.5-1% annually. Offer high liquidity and transparency without storage hassles
Sovereign Gold Bonds (SGBs): Government-backed securities with interest payments and tax benefits. Unfortunately, no new tranches are being issued currently
Digital Gold and Silver: Platforms like eBullion allow investments starting from ₹100, making precious metals accessible to small investors
Gold Monetization Scheme: Allows depositing idle gold with banks to earn interest
Tax Implications and Considerations
Physical Metals: GST applicable, plus making charges and storage costs
ETFs: More tax-efficient for investment purposes
SGBs: Capital gains tax exemption if held till maturity
Key Factors Influencing the Gold Silver Ratio
Economic Indicators
Inflation Trends: Both metals serve as inflation hedges, but gold typically responds more strongly to monetary debasement
Interest Rates: Federal Reserve rate cuts signal strong growth outlook for gold. Lower rates reduce opportunity cost of holding non-yielding assets
Currency Movements: The ratio correlates strongly with the US Dollar Index. A weakening dollar typically favors both metals but affects silver more due to its industrial component
Industrial Demand Dynamics
Silver’s industrial applications create unique price dynamics:
Clean Energy Revolution: Solar panels and electric vehicles are driving unprecedented silver demand. The Silver Institute forecasts demand to exceed supply for the next 5 years
Electronics and AI: Consumer electronics growth and AI development increase silver consumption
Medical Applications: Silver’s antimicrobial properties drive medical and water purification demand
Supply-Side Factors
Mining Production: Gold mining output remains relatively stable, while silver faces production challenges
Central Bank Policies: Central banks buy over 1,000 tonnes of gold annually but don’t purchase silver, creating fundamental demand differences
Recycling Patterns: Different recycling rates affect the available supply of both metals
Future Outlook: What Lies Ahead
Expert Predictions for 2025-2026
Gold Price Targets: Analysts expect gold to potentially reach $2,950 per ounce by late 2025
Silver Price Projections: Silver could reach $35-40 per ounce, supported by industrial demand
Ratio Expectations: The ratio could decline to 70:1 by 2025, closer to historical averages
Long-term Trends to Watch
Industrial Silver Shortage: A deficit of 750 million ounces over four years supports higher silver prices
Central Bank Gold Accumulation: Continued central bank buying, especially from emerging markets
Renewable Energy Boom: 20% of global silver now goes to renewable energy projects
Potential Risk Factors
Economic Recession: Could temporarily boost the ratio as investors flee to gold
Industrial Slowdown: Reduced manufacturing could dampen silver demand
Monetary Policy Changes: Unexpected central bank actions could disrupt current trends
Investment Strategies for Different Risk Profiles
Conservative Investors
For risk-averse investors focusing on wealth preservation:
- Maintain core positions in both metals regardless of ratio fluctuations
- Use ratio extremes for minor rebalancing (10-20% of holdings)
- Prefer physical gold and silver ETFs over aggressive trading strategies
- Focus on long-term wealth protection rather than short-term gains
Moderate Risk Investors
Balanced approach combining stability with growth:
- Implement the 80/50 rule with disciplined execution
- Allocate 70% to core holdings, 30% to ratio trading
- Use systematic investment plans (SIPs) in precious metals ETFs
- Monitor ratio monthly and rebalance quarterly
Aggressive Traders
For those comfortable with higher volatility:
- Actively trade ratio extremes above 90 and below 40
- Use futures and options for leveraged exposure
- Implement three-way strategies involving copper
- Monitor ratio daily and execute rapid position changes
NRI Considerations
For Non-Resident Indians:
- Gold and silver ETFs offer best accessibility without physical storage challenges
- Consider currency hedging when investing from foreign earnings
- Understand tax implications in both resident and Indian contexts
- Use international precious metals platforms for broader access
Common Mistakes to Avoid
Timing Errors
Chasing Extremes Too Early: Just because the ratio seems high doesn’t mean it can’t go higher
Ignoring Transaction Costs: Storage, insurance, and transaction costs can significantly impact returns
Over-leveraging: Using too much borrowed money in volatile precious metals markets
Strategic Missteps
All-or-Nothing Approaches: Putting entire precious metals allocation into one metal based on ratio alone
Ignoring Fundamental Trends: Focusing solely on ratio without considering underlying supply-demand dynamics
Short-term Thinking: Expecting immediate mean reversion when ratios can stay extreme for extended periods
Practical Oversights
Storage and Security Issues: Underestimating costs and risks of physical ownership
Tax Planning Negligence: Not optimizing for tax-efficient investment structures
Liquidity Assumptions: Assuming all precious metals investments offer same liquidity
Conclusion: Making the Gold Silver Ratio Work for You
The Gold Silver Ratio at 81.5:1 in September 2025 presents a compelling case for silver investments. With the ratio sitting 30% above historical averages and silver delivering its best performance in 10 years with 56% gains, the current market dynamics favor the white metal.
However, successful ratio-based investing requires patience, discipline, and proper risk management. The ratio’s historical tendency to mean-revert offers opportunities, but timing these movements precisely remains challenging.
For Indian investors, the current environment offers multiple pathways to precious metals exposure. Whether through ETFs for convenience, SGBs for tax benefits, or physical metals for psychological comfort, the key is maintaining appropriate allocations and using the ratio as one of several decision-making tools.
Remember: The Gold Silver Ratio is a powerful indicator, but it works best when combined with fundamental analysis, technical indicators, and a clear understanding of your investment goals. As markets continue evolving with industrial demand for silver growing and central banks accumulating gold, staying informed about these dynamics will help you make better investment decisions.
The current elevated ratio suggests silver may offer better value relative to gold, but always invest within your risk tolerance and maintain proper diversification across asset classes. The yellow metals market rewards patient, well-informed investors who understand both the opportunities and risks inherent in ratio-based strategies.