Gold Price Chart– Gold may record a second weekly decline. Battle lines have been drawn on the short-term technical chart of XAU/USD. Resistance $3288, $3320 and $3381 (key level)- Support 3190, 3130 and 3010 (key level).
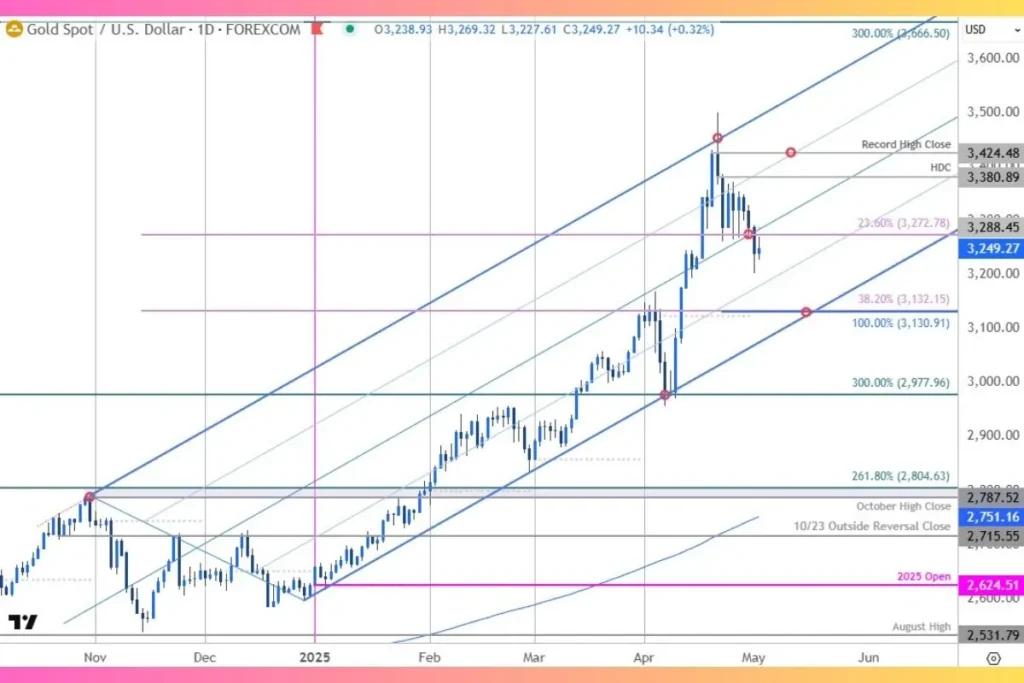
XAU/USD forecast with Technical Analysis
Gold (XAU/USD) has dropped below its upward trend line for the first time since April, which could mean a bigger drop is coming. If gold stays below the middle line, it might keep falling. For traders, losses should stay above 3130 if gold is going to rise again. To aim for new highs, gold needs to close above 3320
- The US and China are not negotiating on tariffs
- MCX Natural Gas Tips for Today (02-May-2025)
- Emini S&P June futures
- Suzlon Energy Share Rises 0.69% in Early Trade on May 2 Amid Sector Momentum
- Adani Ports & Special Economic Zone consolidated net profit rises 47.78% in the March 2025 quarter
Note:
Keep in mind we in the early throws of the May 2025 opening-range with the Federal Reserve interest rate decision on tap next week. Stay nimble into the release and watch the weekly close here for guidance.
✅ Disclaimer: Goldsilverreports.com provides stock market news for informational purposes only and should not be construed as investment advice. Readers are encouraged to consult with a qualified financial advisor before making any investment decisions.