gold price chart today
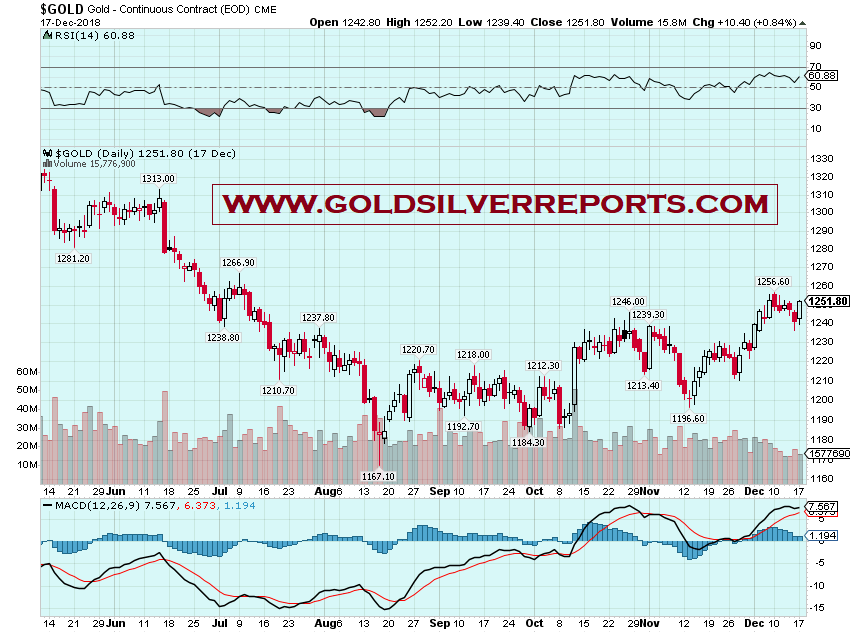
Spot Gold May Rise into $1253 —$1258 Level
Gold Silver Reports (GSR ) – On the daily chart, the gain on Monday confirms a break above the former resistance at $1,238, the 14.6 percent projection level of a downward wave C from $1,366.07. The next Resistance will be at $1,305.
Gold Comex Live Report Below $1245 Level No Buying
Gold Comex Live Report Below $1,245 Level No Buying,
Comex Gold Down Side Support $1,218 Level
Technical Power of CFA’s
(CHARTRED FINANCE ANALYST)
“No Magic, No Miracle, Just Power of Level”
Neal Bhai Reports (NBR) By CFA’s and MFA’s Technical Team
Mobile No. 9582247600 & 9899900589
Comex Gold Live Report & Technical Analysis……
Gold Edges Back Above $1200 as Dollar Rally Stalls
Gold Silver Reports (GSR) — That caused spot gold to climb to $1,200.30 per ounce, after the metal fell to its lowest since Oct. 11 at $1,195.90 earlier in the day. U.S. gold futures settled at $1,202.40 per ounce.
Gold Comex Live Report – Below $1243 Ultimate Target $1197 — $1154 — $1124 Need Patience – Neal Bhai Reports
Gold Comex Live Report – Below $1243 Ultimate Target $1197 — $1154 — $1124 Need Patience – Neal Bhai Reports
Gold Spot Made Diamond Shape Brekaout Hurdel $ 1209 — $ 1211 Stya Above Ready For Next Big Boom Seller Be Alert???? – Neal Bhai Reports
Gold Spot Made Diamond Shape Brekaout Hurdel $ 1209 — $ 1211 Stya Above Ready For Next Big Boom Seller Be Alert???? – Neal Bhai Reports