Like many other commodities, copper prices have been on a tear in recent weeks. But the month of May has not been kind, at least in recent days: even though copper prices are up by +1.43% on the month, they are actually down -7.26% from their high set on May 10. Why might this be?
In recent days, news has emerged from China that officials will take steps to curb “unreasonable” price appreciation. According to Chinese state television, Chinese Premier Li Keqianq chaired a meeting in which the results produced promises to manage spot and future markets more closely and adjusting stockpiles of copper more frequently in response to market conditions.
Read More : MCX Copper Short Term Tips : Crucial Key at 752 Target 727—712
The net-impact of the news from China has been a perception that, given price gains this year, the measures will ultimately curb demand in the near-term for copper prices. In chart 1 above, refined copper demand surged to an all-time high in April 2021 at 203,800 metric tons; in April 2020, this figure read 129,790 metric tons. During this time, copper prices also surged to an all-time high; the correlation between monthly Chinese refined copper demand and copper prices over the past five years has been +0.63 (n=60).
COPPER PRICE TECHNICAL ANALYSIS: DAILY CHART (MARCH 2020 TO MAY 2021) (CHART 2)
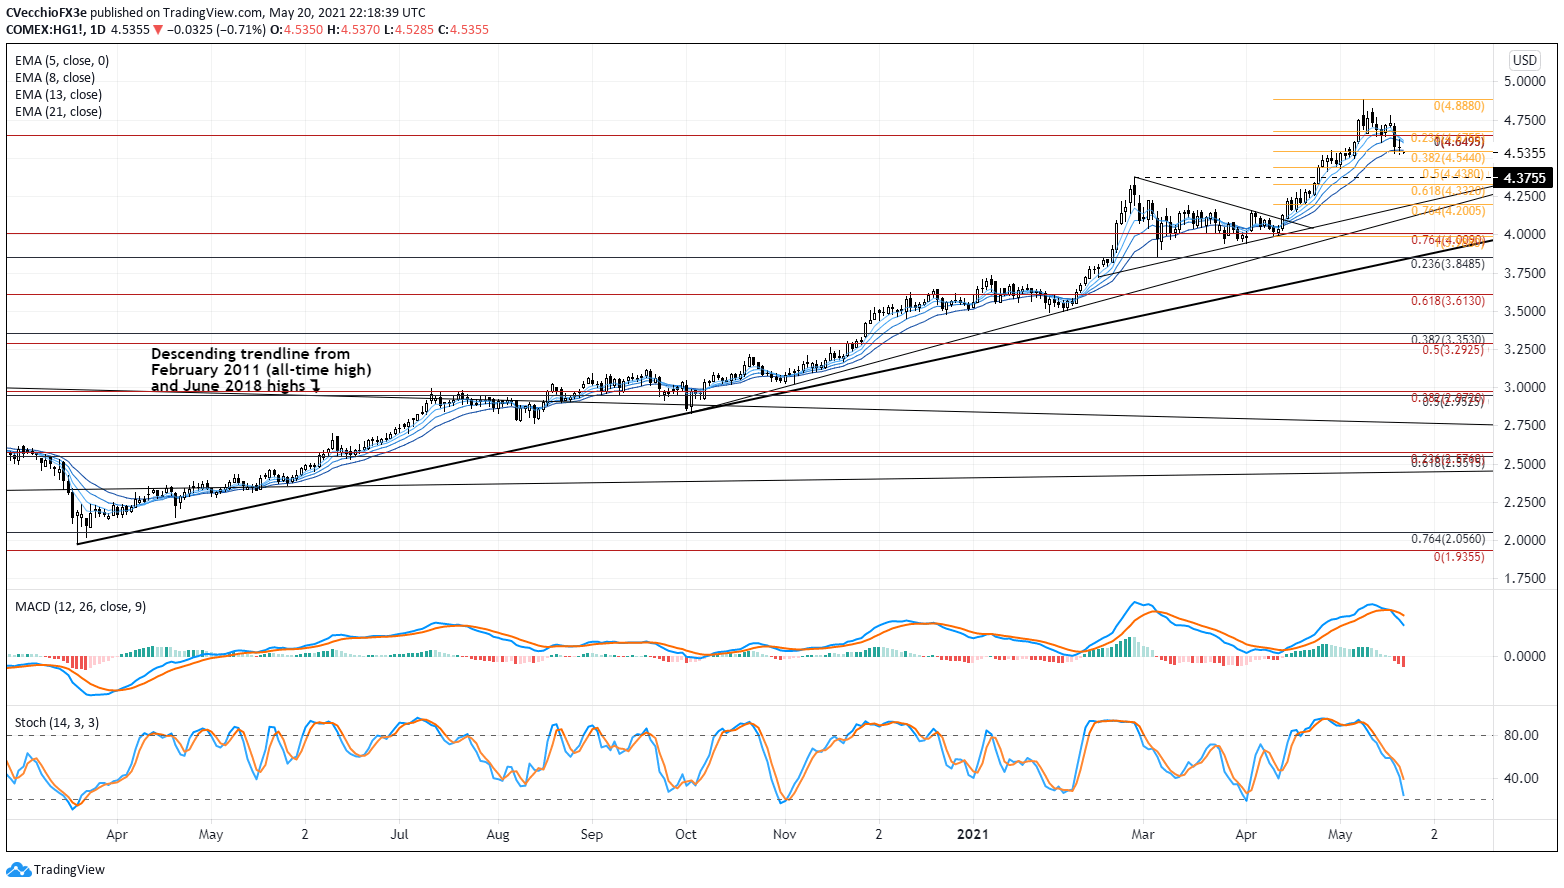
The prior copper price forecast issued in mid-April was titled “Bullish Breakout Pacing Towards Yearly High,” and copper prices proceeded to set a fresh all-time high by May 10. However, since May 10, there has been material technical damage that suggests a deeper pullback from the all-time highs may ensue.
Of note, copper prices have fallen below the 38.2% Fibonacci retracement of the April/May move, a technical warning signal of weakness within the uptrend. Concurrently, momentum has turned relatively bearish.
Copper prices are below their daily 5-, 8-, and 13-EMAs, clinging to the daily 21-EMA as support (which wasn’t consequential during the April/May rally, for what it’s worth). As daily MACD turns lower while above its signal line, daily Slow Stochastics have already slipped below their median line and are quickly approaching oversold territory.
A return back to the former yearly high established in February at 4.3755 may be on the horizon before buyers step back into the market.
COPPER PRICES TECHNICAL ANALYSIS: WEEKLY CHART (NOVEMBER 2008 TO MAY 2021) (CHART 3)
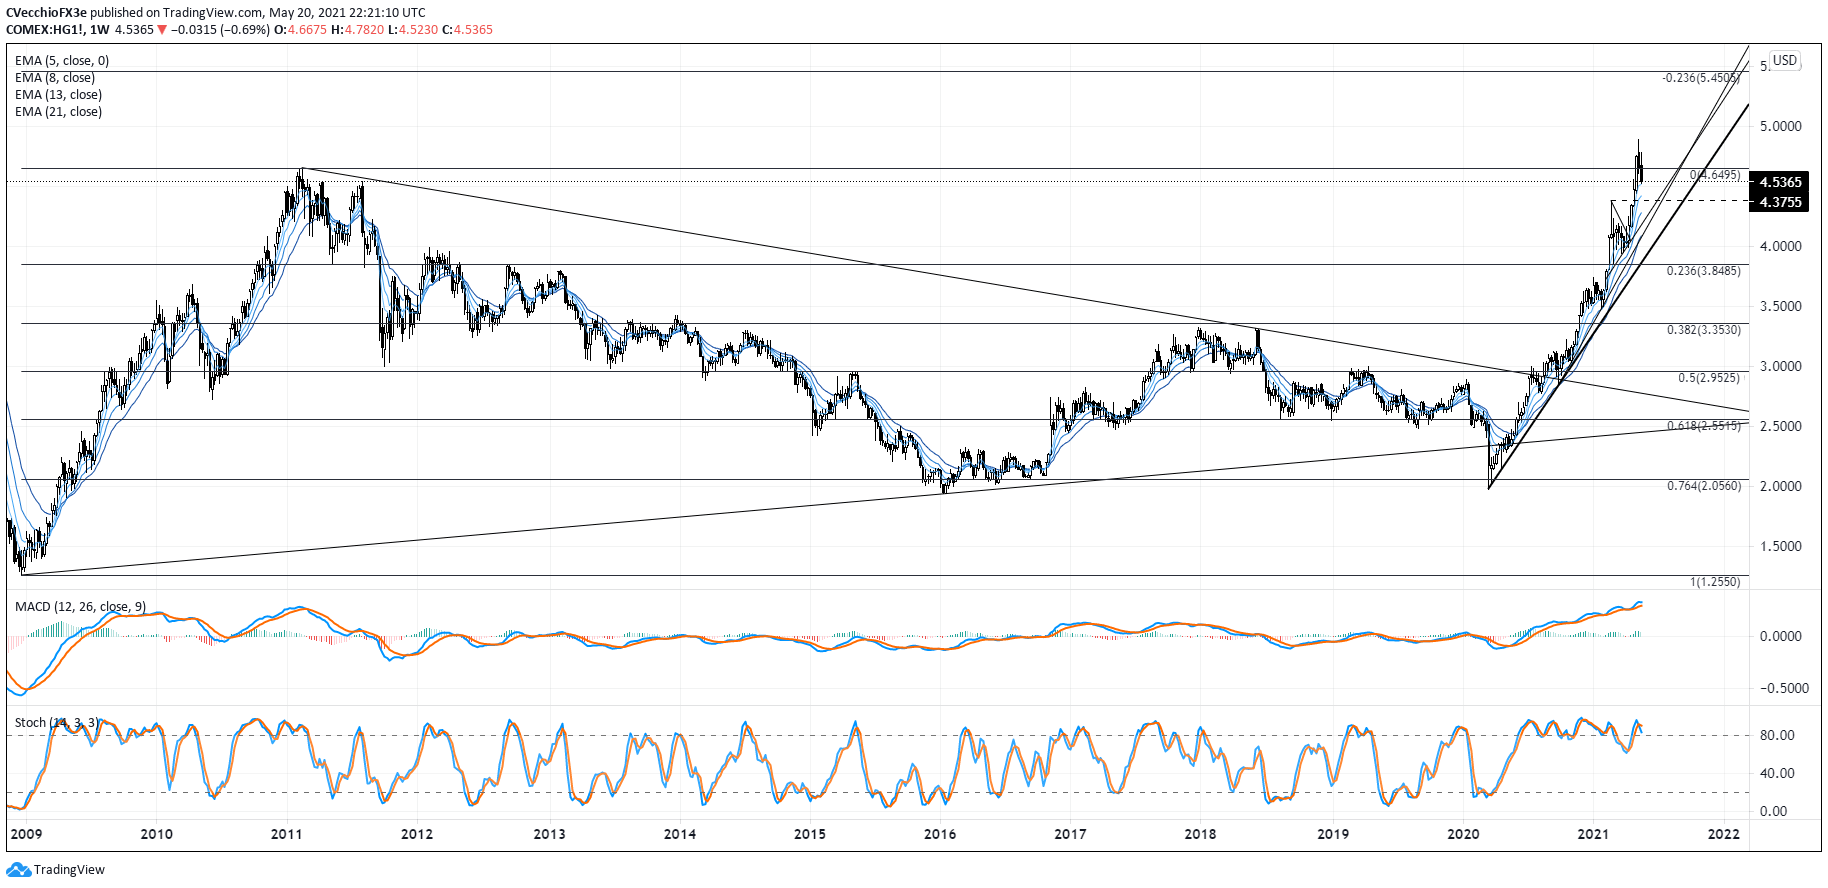
The perspective noted in mid-February remains valid: “Copper prices’ breakout above the descending trendline from the February 2011 and June 2018 highs suggests that a multi-year bottoming process commenced in mid-2020.
This point of view is reinforced by the failed bearish breakout in early-2020, which saw the multi-year symmetrical triangle support temporarily lost for a few weeks. Clearing the June 2018 high officially ended the multi-year series of ‘lower highs and lower lows.’ As long as the uptrend from the March and October 2020 swing lows is maintained, copper prices retain a bullish bias.”